DriveSpeedTest
An honest external-SSD benchmark that says whether the drive, cable or port is the bottleneck.
 Eddie OffermannDesign and engineering
- Role
- Design and engineering
- Areas
- Tools, Apps

Quick drive-speed tools often write compressible zeros, never flush to the device and read the data back from RAM, so a USB drive can appear faster than its own link allows. DriveSpeedTest measures the actual device instead, with unbuffered, write-through, sector-aligned I/O and incompressible data.

What it checks
- Throughput: sequential and random 4K reads and writes with the cache bypassed.
- Sustained writes: several gigabytes charted over time to expose the point where an SSD's fast SLC cache fills and speed drops.
- The connection: the negotiated USB link speed, found with the same device tree walk that USBView uses, plus host controllers, TRIM and filesystem. Because Windows sometimes reports a SuperSpeed device as USB 2.0, the tool infers the real tier from the device descriptor and confirms it against measured throughput.
- SMART health, through
smartctlwhen available and Windows reliability counters otherwise. - Marketing claims: paste the vendor's blurb and each claim is graded against what was measured, with a ranked list of likely bottlenecks and fixes.
A React dashboard streams each phase live over a WebSocket and exports JSON or text reports. Playwright drives a demo mode to regenerate the documentation screenshots. The app refuses the system drive by default and cleans up its test files.

It pairs with b2cFastCopy, which reacts to the same cache cliffs during a copy.

Gallery

Pick a drive and a test depth. The system drive is refused by default. 
Each phase streams live over a WebSocket. 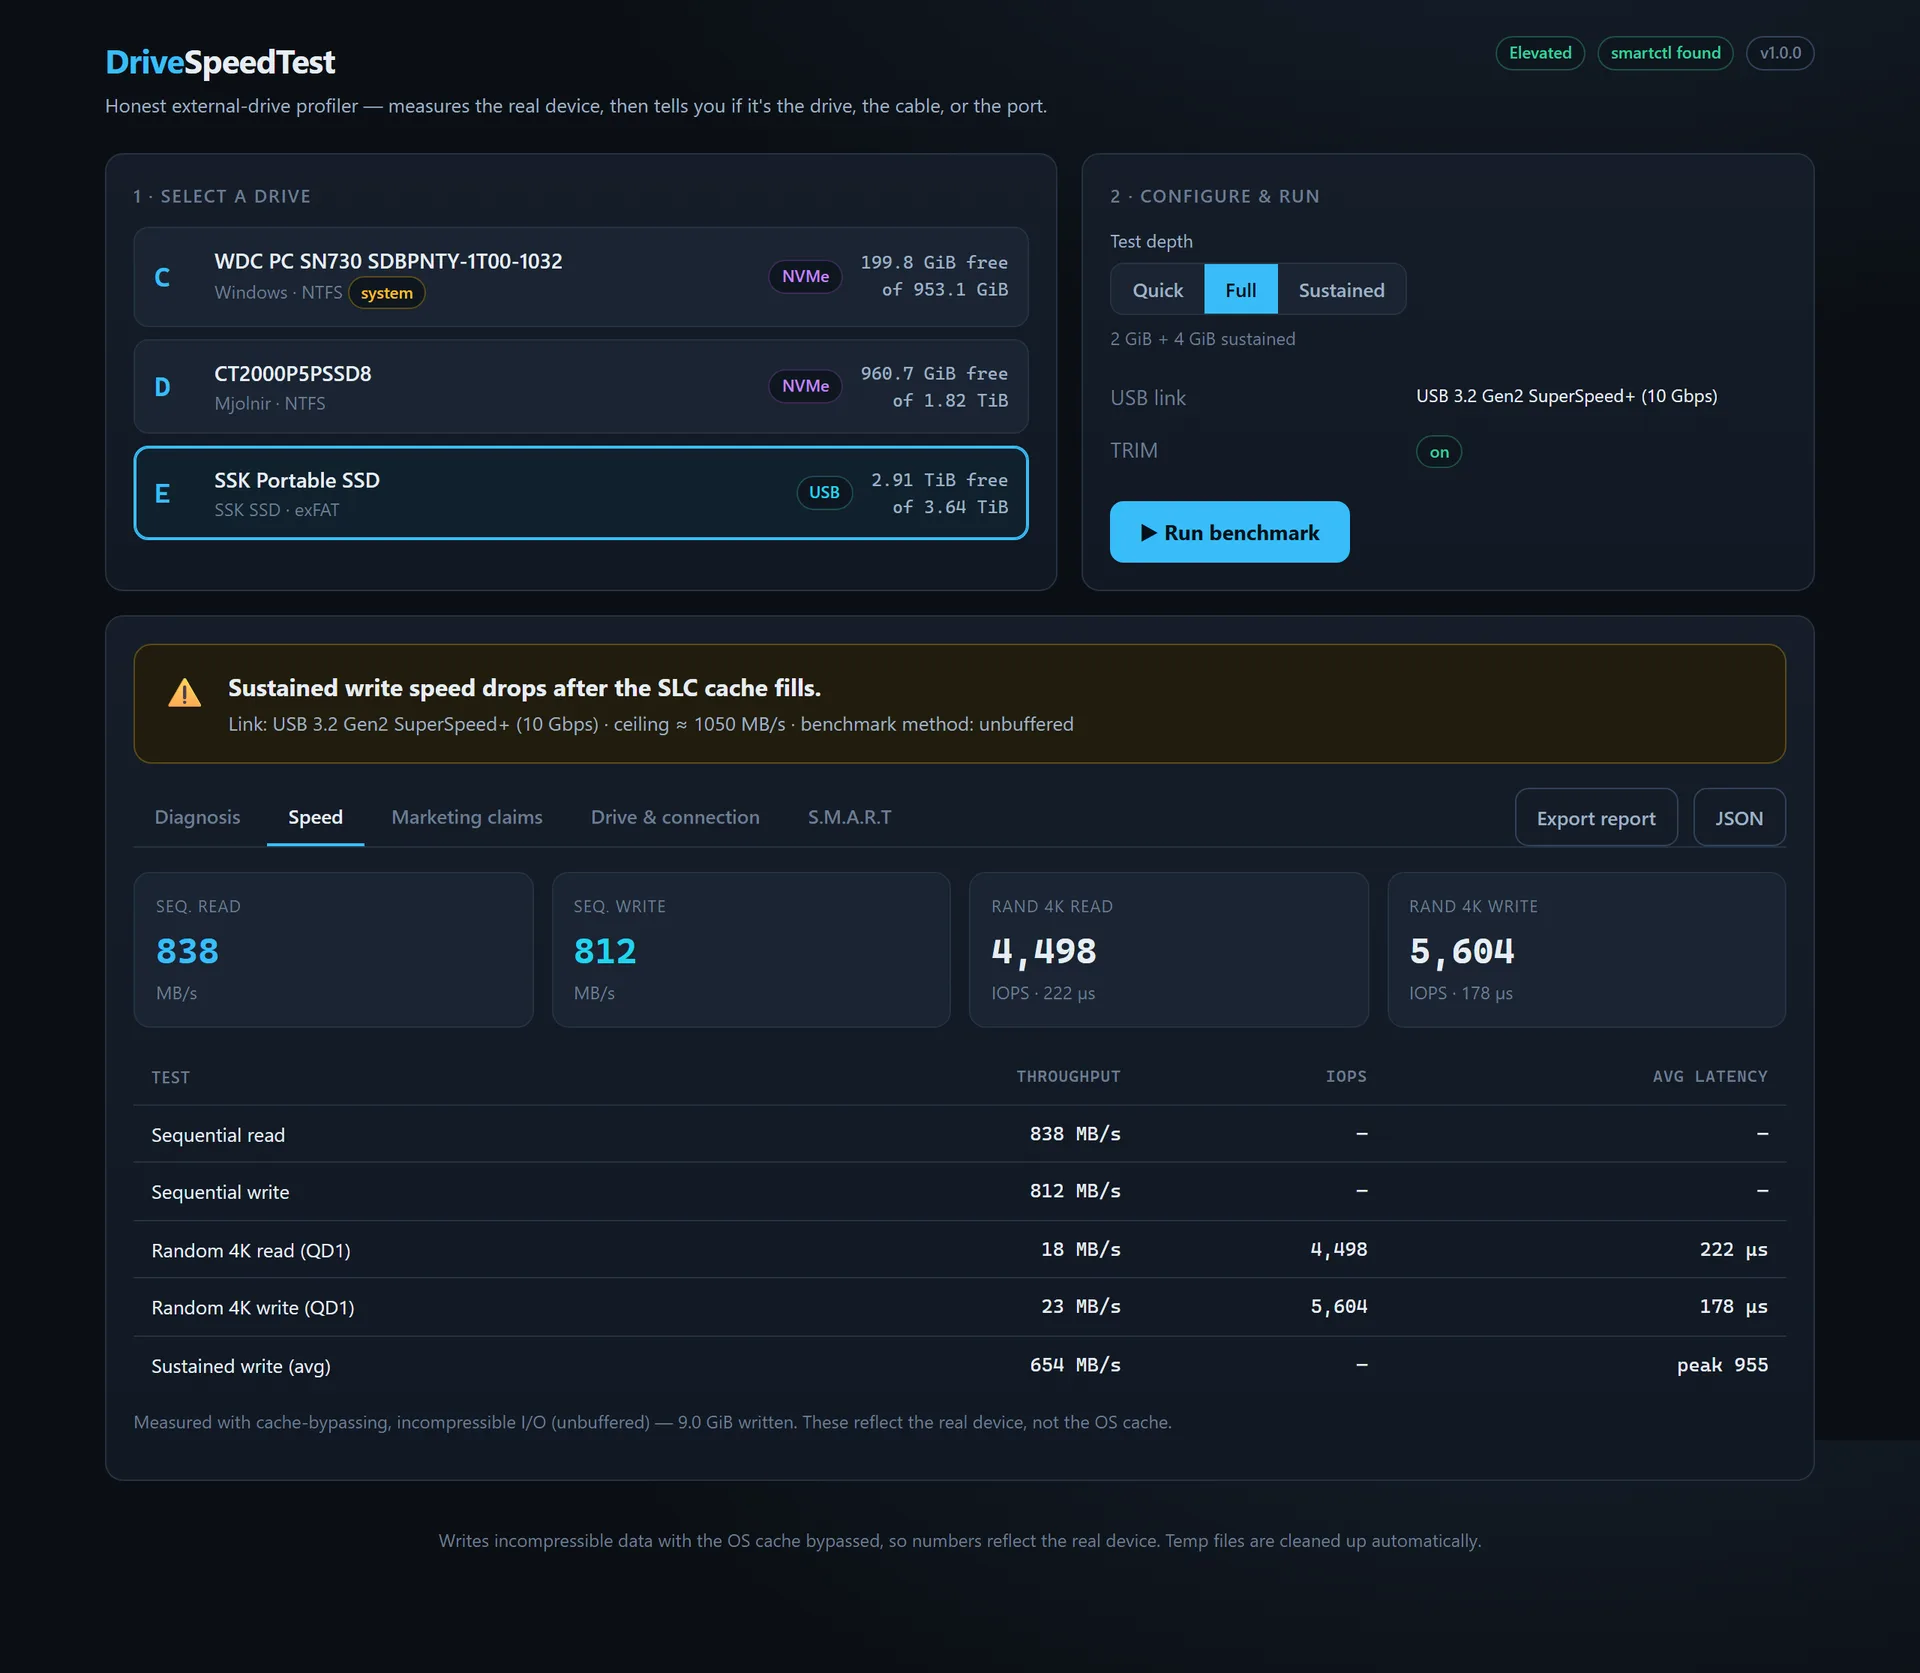
Cache-bypassed throughput results. 
Paste the vendor's blurb and each claim is graded against the measurement. 
SMART health, through smartctl or Windows reliability counters.
Links
Sources
Related work
-
B2C Webmail
A lightweight HTML email sender for Gmail, with three interchangeable UIs and a CLI.
-

BigBlueBam and the B-Suite
A work suite where AI agents work alongside people, with the same permissions.
-
Cardforia and SecureVR
Unity building blocks for phone-based AR and VR.
-
DisplaySystemTray
One-click display modes and saved monitor layouts from the Windows tray.